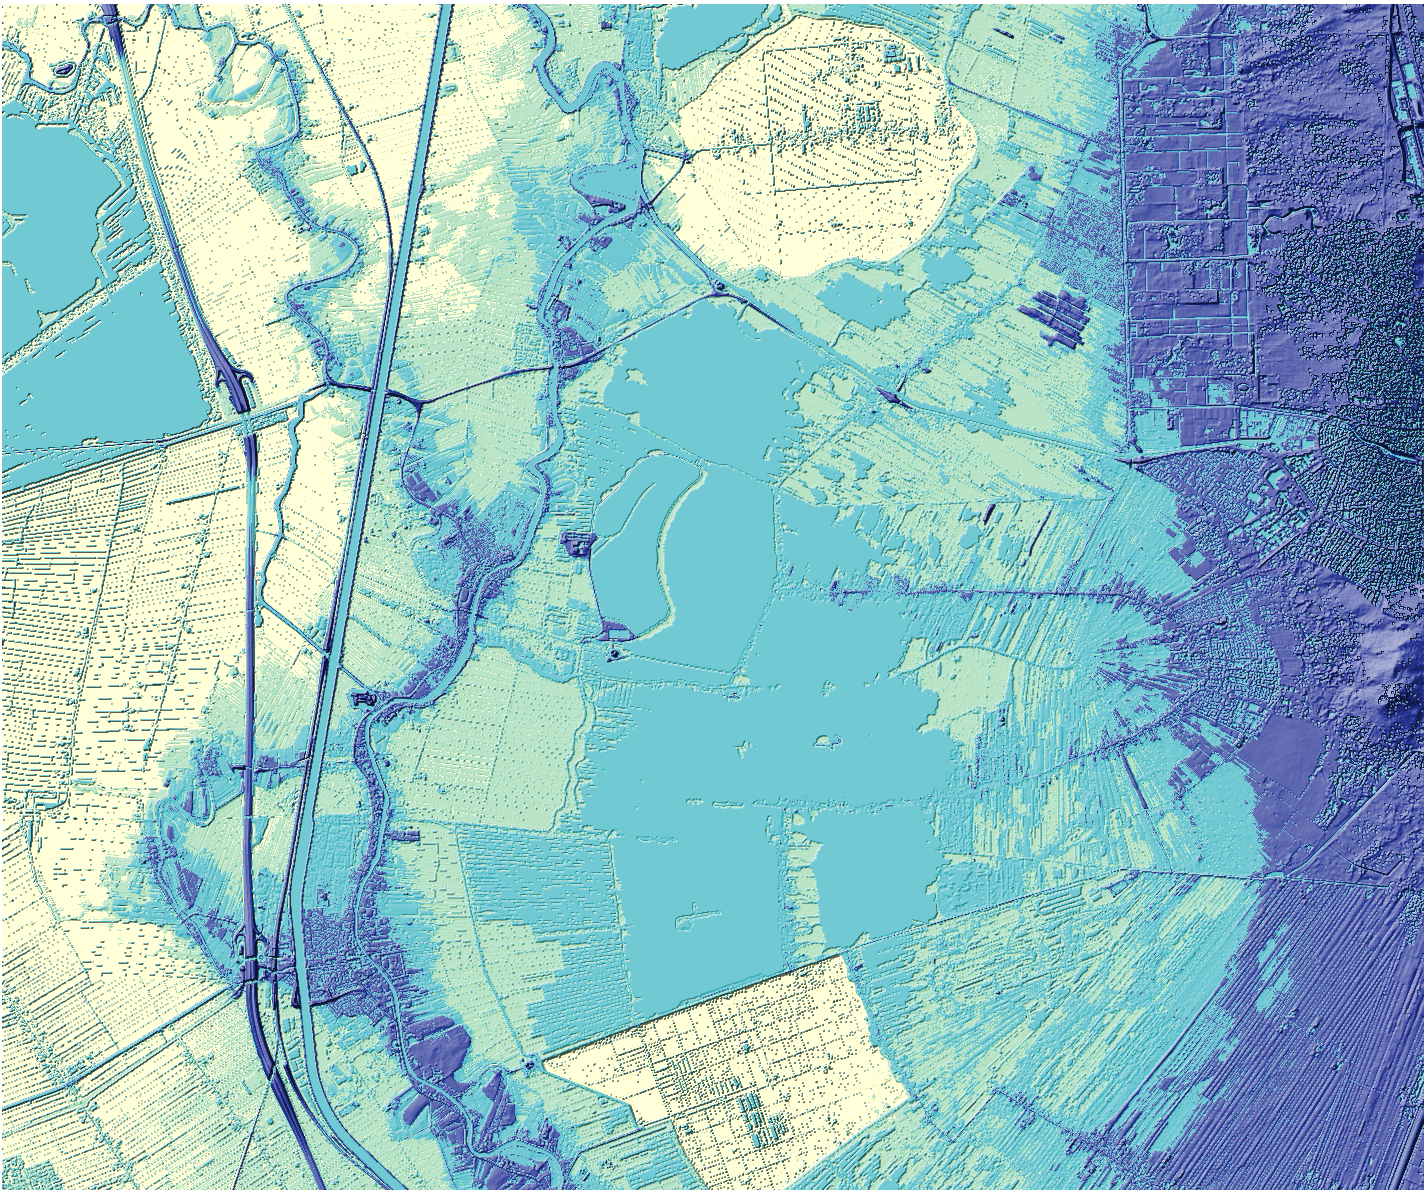
Relative Elevation Model
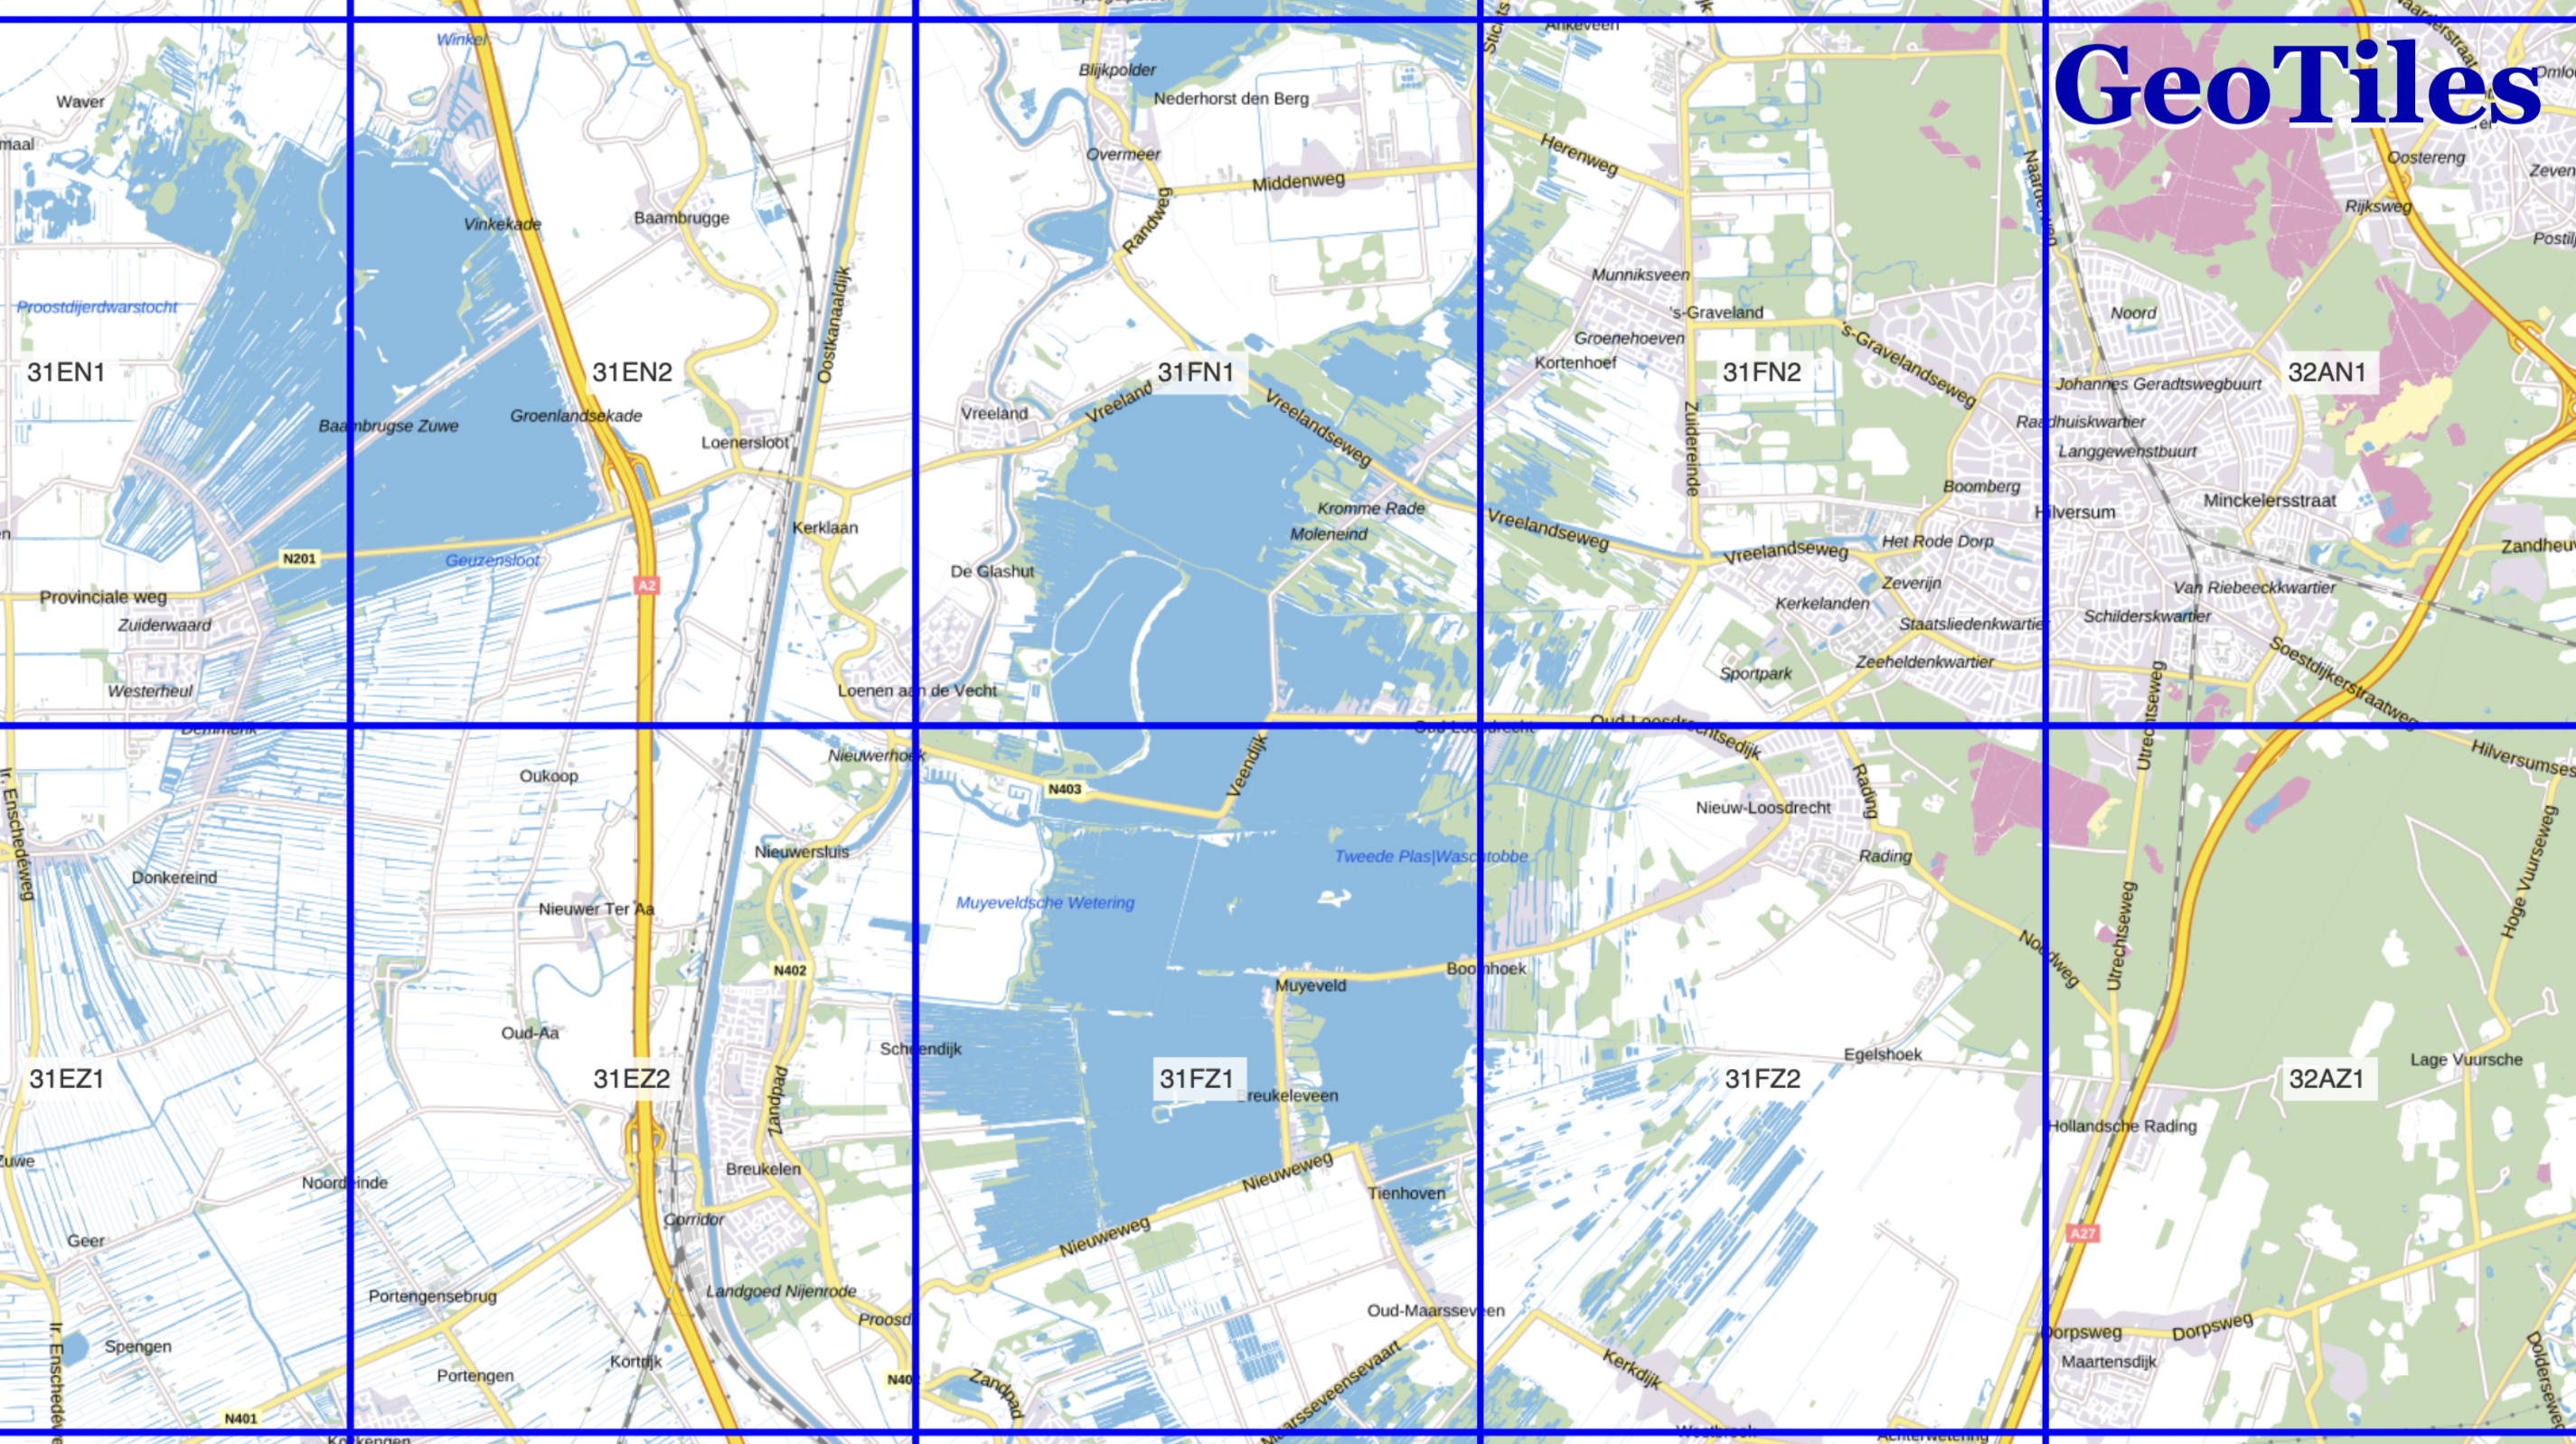
For this map, I created a relative elevation model. This was first done by choosing an area and downloading the data from Geotiles. In the figure above, I looked at tiles 31EN2, 31FN1, 31FN2, 31EZ2, 31FZ1, and 31FZ2. I then imported these tiles into QGIS in order to create a relative elevation model map. I chose this area specifically as it has this large body of water in the middle as well as rivers around it. With fiels and a city nearing it, I thought it would be interesting to look at the changes in elevation in relation to the distance from the large body of water and rivers.
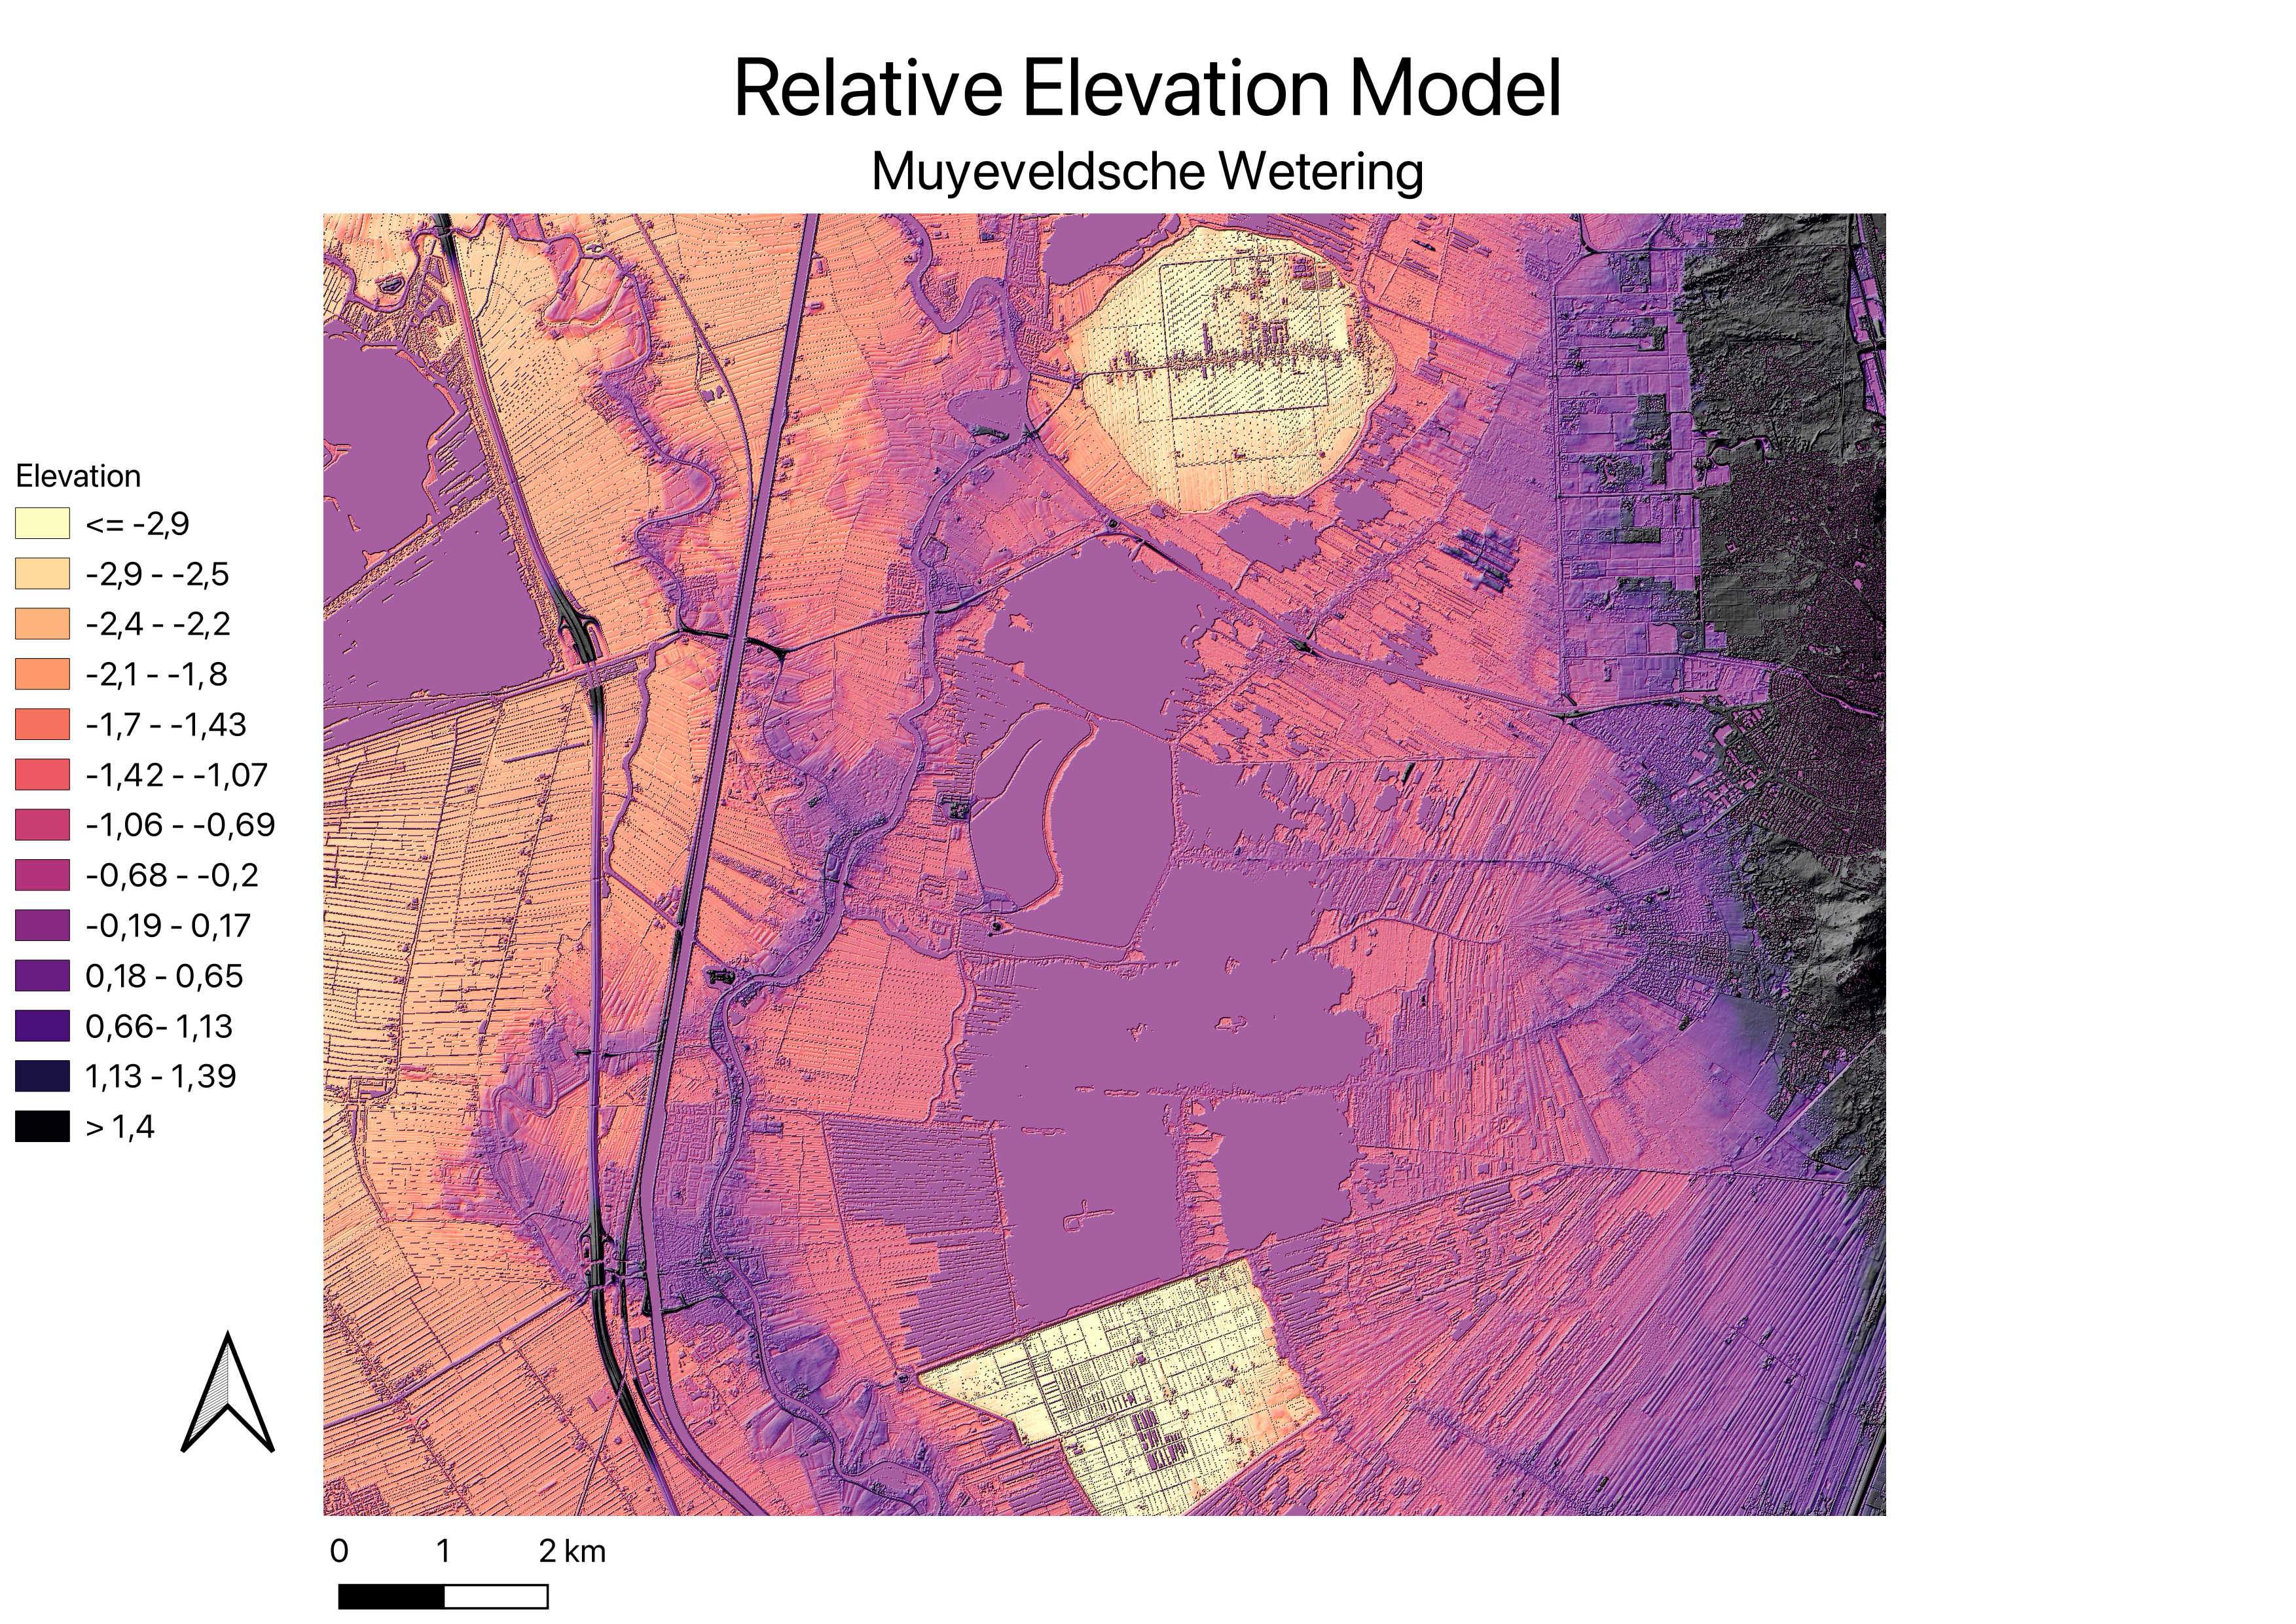
This was my final map in which I had to make many decisions to make it look the way it does now. The first decision I had to make was regarding the colour scheme. I picked this color scheme because I found that the light areas represented well low elevations and the purple had a strong contrast which was most obvious in bodies of water. When there are very high elevations, the color is almost black allowing it to not be confused with bodies of water. The second decision I had to make was the elevation stretch. In this map, the stretch is between -3 and 2. This is because, this area of the Netherlands does not change that much in elevation however, it has a peak going much higher which is considered an outlier. In order to show that the bodies of water were generally higher than the land surrounding it, I needed to put all the outliers together which is why all changes in elevation above 1.4 meters are grouped together. The stretch and the colour together also allowed us to see the sides of the river are slightly more elevated allowing for less flooding of the land if the water rises.
Change in Elevation Stretch
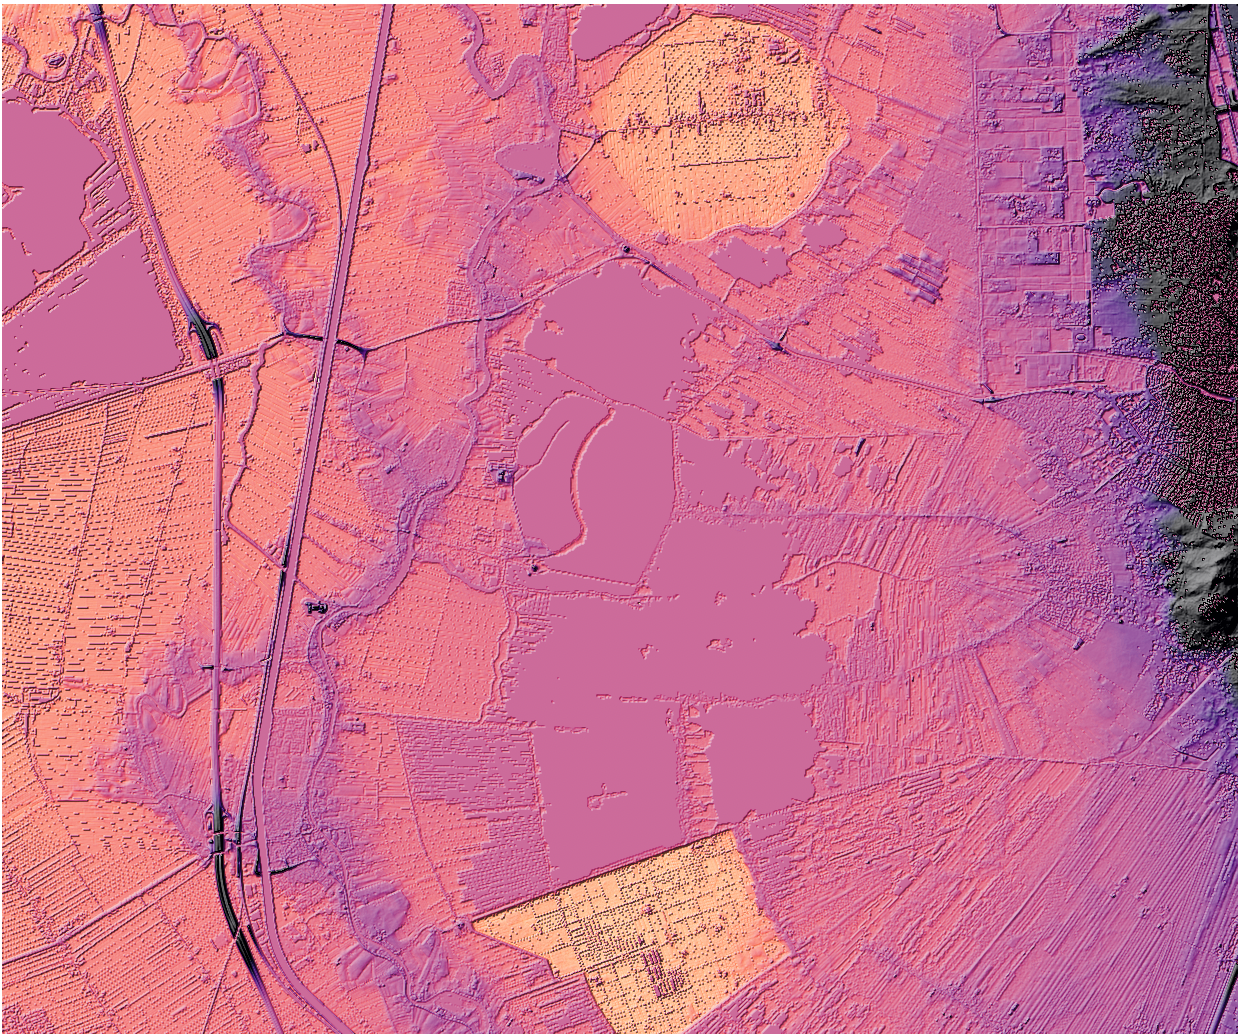
This map is my original map with a change in the elevation stretch to -5 to 3. As we can see, this drastically impacts what we understand. Water bodies are much harder to differentiate from land as they are a lighter colour. The only areas that are easily determined are the low and high peaks.
Change in Color Scheme
This map is my original map with a change a change in the elevation stretch. There are some areas that are more easily understandable such as the slight increase in height around the river. This can more clearly be seen in this map than in the original one. On the other hand, because it uses very similar colors, it makes the low and high peaks seem not too different from the rest of the land.